Showing posts with label telecity. Show all posts

Thursday, October 10, 2013

Is Equinix in a Bubble About to Burst?

Those of you old enough to be investing before the year 2000 will recall that there there was another recession in the last decade or so. Many investors have forgotten about the technology boom and bust that occurred at the start of the last decade. However, in certain sectors like telecommunications and Internet infrastructure, the scars still run deep. Indeed, stock prices of data center providers like Equinix (NASDAQ: EQIX  ) , InterXion (NYSE: INXN  ) , and the U.K.'s Telecity are all down in 2013, largely because of fears of the sort of overcapacity that plagued the economy after the tech bust. Are the concerns justified? Is now a time to buy?

As is always the case in investing, the answer is yes, and also no.

Why it's a "no"

Economics 101 will tell you that most industries follow a pretty familiar path. High profits in an industry tend to encourage new entrants (or in this case, encourage existing providers to invest in new data centers), and capacity increases as everyone enjoys profits. After the initial profit euphoria, history tells us that firms tend to over-invest, only to then see profitability fall as too much supply is on tap. Indeed, all the leading players have been aggressively expanding data center capacity in recent years.

Of course, the problem for investors comes when profitability starts to fall in anticipation of tougher conditions. Analysts start downgrading their price targets, and suddenly the roof caves in on your stock. Everyone then realizes that end-demand was vastly overestimated. All of this happened in 2000 with Internet infrastructure darlings like Cisco Systems (NASDAQ: CSCO  )  and Alcatel-Lucent. The fallout was painful.

CSCO Chart

CSCO data by YCharts

Fast-forward to today and there are signs that the data-center providers may be facing overcapacity issues. The single best indicator is probably gross margin. Decline is an indication of a drop in pricing power, while an increase represents the contrary.
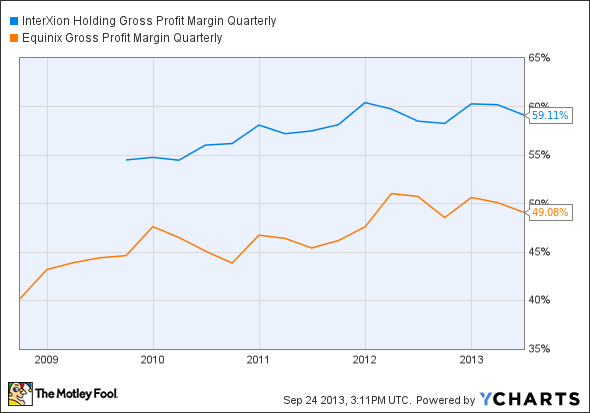
INXN Gross Profit Margin Quarterly Chart


Gross margins look like they are moderating for InterXion and Equinix. Furthermore, Telecity saw its gross margin decline in the first half from 57.3% last year to 56.9% this year. Telecity's revenue per occupied square meter increased only 2.1%, which suggests that future revenue increases will come from capacity expansion rather than pricing.

Turning to Equinix, it reduced its forecast for second-half revenue growth, partly because it saw softer conditions in Germany, longer sales cycles within its enterprise markets, and its average deal size appears to be getting smaller. All three are signs of slower growth. 

InterXion gave results in August, stating:

Customers continue to have extended decision-making time frames, but demand remains healthy and the pricing environment is consistent with previous quarters, as is the sales pipeline.

Again, when sales cycles get longer, it is usually a sign of a slowing market. If pricing is consistent, it implies the industry players are finding it harder to increase them.

Why it's a "yes"

This isn't the late 90s. It really is different this time around because long-term demand looks much better-placed.

Internet-enabled devices -- smartphones, tablets, etc. -- simply weren't available back then in order to drive demand for all the network capacity that had been built up. It's a different story now. AT&T and Verizon are both seeing strong smartphone subscriber growth, and Intel has had to take substantive action to change its business, thanks to the shift to mobile devices.

It's a similar story with corporate demand for cloud computing, and software as a service (SaaS) applications. All of which is leading to demand for data centers to store information and applications for corporation. Moreover, financial services firms are not displaying any slowdown in their desire to use increasingly complex trading systems.

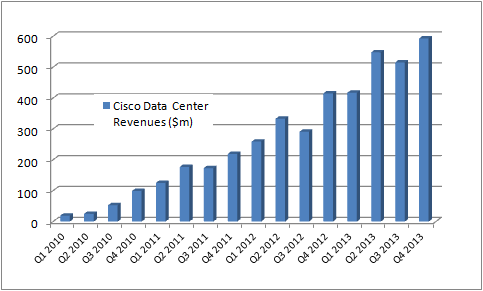
Data center demand remains high as evidenced by Cisco's revenues.

source: company accounts

Where next for Equinix?

In conclusion, end demand does appear to be slowing, and analysts/investors are starting to downgrade expectations. However, this is arguably reflected in Equinix's  share prices right now. The key valuation metric -- as defined by Equinix -- is the 'adjusted discretionary free cash-flow.' Roughly speaking, this is the free cash flow generated if you strip out the expansionary CapEx. In its last update, Equinix forecast this figure to be around $620 million to $640 million for 2013, which represents around 5.2% of its current enterprise value. 

 
The valuation looks fair, but the stock carries the normal risks inherent in industries that are facing short term risk. If you are a cautiously minded investor, you might wait for a better entry point to compensate for the risk that margins start to fall. Alternatively, you could monitor gross margins, and industry pricing power in order to gauge when the demand has caught up with capacity.

Tuesday, February 14, 2012

Telecity Set to Benefit From Cloud Computing Growth


facebook-datacenter-electrical-large.jpg


A good set of results from Telecity $TCY which highlight how this stock benefits from the growth in internet traffic and cloud computing. Data centers are a very good ‘picks and shovels’ play and companies like Equinix $EQIX are seeing strong growth in end demand. Inevitably, this is causing increased capital expenditures as the data center providers expand capacity.

The potential downside here is that this ramping of capacity (the likes of Equinix and Telecity are expanding aggressively) will cause a supply glut which will lead to falling margins just as the data centers need cash flow in order to pay back the debt needed to expand capacity. No matter, right now, this doesn’t look like being a problem and investors will see the early signs when Telecity et al, start reporting slipping EBITDA margins. The growth in internet traffic is progressing at an exponential rate and increases in cloud computing will only strengthen the case.


Telecity is a Good Play on Cloud Computing

Turning to the expansion program, Telecity has nine simultaneous locations in development at the moment. Over the course of the last year, they expanded capacity to 68MW from 58MW last year. A further 10MW is expected to come online within the next six months and, longer term plans for a total of 124MW in three to four years are already in place. This is almost a doubling of current capacity, but Telecity has good reason for confidence over these plans.  

For example, 95% of last year’s revenues were recurring and 60% of organic growth came from existing customers, with only mid single digits churn. Clearly, Telecity’s end demand is very sticky and they are seeing strong growth from existing clients who need expansion to meet their mission critical demand.  Ultimately, this provides Telecity with a high visibility of earnings.


Telecity’s Growth Drivers

Moreover, the growth in internet traffic is broad based across sectors and, has proved to be recession resistant. This looks like a structural growth story and, will only increase as cloud computing and data traffic increases. Whilst, superficially, there is no moat in data center provision, it is in fact a mission critical application which requires substantial planning and trust on behalf of the clients.

An example of the broad base of Telecity’s clientele can be seen when looking at the breakdown of new customer wins by application type

  • 29% content
  • 24% financial
  • 16% connectivity
  • 16% systems integrator
  • 15% cloud computing

Financial simply refers to financial transactions through the centers. The diversification in usage belies the growth potential for Telecity.


Telecity Financials

At a current price of 650p the stock is valued at £1287m. Telecity currently has £164m in net debt, which put together gives an Enterprise Value of £1451m. This stock is obviously not bought for its dividend, even though Telecity is promising to pay 20-25% of its earnings in dividends. For those interested, this would make 6p or 1% yield based on analyst forecasts for 2012. The company expects to commence dividends at the half year in 2012.

The key to Telecity is to think if it as a cash generating ‘annuity’ type stock. It is in the expansion phase now so, superficially, cash generation looks weak but the underlying picture is much stronger. At the full year, Telecity generated £106.5m in operating cash flow from £109.9m in EBITDA and, cash flow conversion has been similarly strong over the years. Telecity spent £109.9m in expansion capex but maintenance capex was only £21.8m. This means that the operating free cash flow was £106.5-21.8m=84.7m or 5.8% of EV.


Telecity Stock Analysis

The underlying cash flow generation is strong and investors should consider that it will, roughly, take four years for a location to reach peak demand. Therefore, the expansion now will generate future revenue growth in the next  few years. Furthermore, the net debt situation of £164m is easily manageable given cash flow generation and a five year £300m debt facility hich was signed in May 2011. There is ample head room for more expansion.

The key thing here is that any investor will need to be confident in the long term growth rates of internet traffic and then try and ‘price’ in this confidence. The correct approach might be to watch gross margins across the industry and see that as a marker for over capacity. However, we are not there yet and Telecity’s stock price is probably at least capable of ‘doing its earnings’ for 2012. On this basis it is better priced at 750p then the current price of 650p.


Source:

Monday, May 30, 2011

Equinix and Telecity Offer Growth and Cash Flows

Equinix $EQIX and Telecity $TCY are two fast growing data center stocks that I believe are cheaply priced relative to their prospects. I hold both stocks but, in this article will focus on Equinix. However, investors can make similar analysis with Telecity as they are very similar.

In summary, data center providers are capable of generating very high Ebitda margins and are set for high growth in revenues. On an ongoing basis, both businesses (Equinix and Telecity) are already generating large amounts of cash flow and provided that operating margins remain the same and the expected growth materialises then these stocks are very good GARP candidates.

Growth Drivers
Data Centers allow business to store their information in a secure and scalable manner. In other words, they let companies focus on running their own business as opposed to setting up their own onsite mini ‘data centers’. Scalability is a key consideration, because I suspect many businesses will have been caught out by the massive increase in capacity necessary to handle increased mobile, video and global IP traffic. In addition, increasing usage of cloud based solutions will only add to data center usage. Industries such as financial services are generating an exponential increase in demand as the search for ever more complex trading systems continues apace.
In addition, the existing infrastructure of centralized provision supply business over great lengths (globally) is likely to run into quality difficulties as ever growing local growth in bandwidth applies strains upon it. All of which, should benefit companies like Equinix and Telecity, who provide local centers and seek to integrate data flow between corporations and the major hubs.
On a more negative note, data centers can be visualised as giant refrigerators so Telecity and Equinix are both exposed to rising energy costs.

Equinix’s Trading Numbers
In the following discussion I will utilise a recent presentation made by Equinix which is referred to in the source section below. The first thing to look at will be how Gross Margins are evolving over time.

Equinix200820092010Q2 2010Q3 2010Q4 2010Q1 2011Rolling
Revenue704,680882,5091,220,334296,094330,347345,244363,0291,334,714
Gross Profit290,021399,089545,667133,512144,871151,685168,453598,521
Gross Margin41.2%45.2%44.7%45.1%43.9%43.9%46.4%44.8%

It’s not hard to see that margins are holding steady, in spite of rising energy costs. In addition, Equinix is keen to point out that gross cash margins (excluding non cash items such as stock options) are actually closer to the long term target of 65%  We can see this effect in the cash flow conversion.
 
Equinix200820092010Q2 2010Q3 2010Q4 2010Q1 2011Rolling
Revenue704,680882,5091,220,334296,094330,347345,244363,0291,334,714
OP Cash Flow267,558355,492392,87256,906113,263122,891117,770410,830
% revs38.0%40.3%32.2%19.2%34.3%35.6%32.4%30.8%
Capex471,128369,542579,397148,705143,941143,351190,066626,063
Free Cash Flow-203,570-14,050-186,525-91,799-30,678-20,460-72,296-215,233


Whilst conversion to operating cash flow is very good, it is clear that Equinix are not generating free cash flow. This is a concern because with a share price of $100 the current market cap is $4.71bn and net debt is $1.67bn. In other words the Enterprise Value is $6.38bn and on a rolling year basis they have just had a cash outflow of $215m

However, the key thing to understand with Equinix is that they are currently in a high growth phase and are undergoing significant expansionary capital expenditures in order to develop revenue growth. With this sort of business it is useful to try and breakdown maintenance from expansionary capital expenditures. Rather conveniently, Equinix do this in page 13 of the linked presentation. Tabulating from their results gives...


Frankly, I think this means that the underlying cash flow is actually very good here. It would be remiss to assume that, going forward, margins and revenue growth will be strong enough to justify this level of expansionary capital expenditure. However, for the reasons articulated above, I think that with decent GDP growth that Equinix can go on to achieve strong revenue growth.
Longer term Equinix feels that maintenance Capital expenditures will come to around 5% of revenues. So, it is not inconceivable that when Equinix’s growth starts to moderate we could see them generating 20-25% of revenues in free cash flow in future.
Analysts have Equinix on 2011 and 2012 revenues of $1.54bn and $1.74bn respectively. This implies 26% and 15.6% revenue growth in the next two years.

In conclusion, I think a forward FCF/EV of around 5% is fair for this business which would give a price target of around $120. Equinix is a good GARP candidate. I hold.

Telecity
I believe Telecity to also be attractively priced. By way of comparison, Telecity with a share price of 548p has a market cap of £1088m and net debt of £56.8m so the EV is £1144m. Turning to the operational metrics from the last results sees Telecity generating adjusted Ebitda margins of 42.4% and ‘operating free cash flow’ margins of 37.9%. This is very high and demonstrates the underlying cash flow generation. Last year Telecity spent £13.3m or 6.7% of revenues on operational capital expenditure and this figures compares well with Equinix’s long term target of 5%
If we use the underlying operational free cash flow of £74.4m as a benchmark then the underlying FCF/EV is 74.4/1144=6.5% For a business forecast to grow revenue at 18% next year, that is too cheap.


Source:

Equinix
2008
2009
2010
Rolling
Forecast 2011
Discretionary FCF
200100
292000
278000
330000
400,000
DFCF/EV
3.2%
4.6%
4.4%
5.2%
6.3%